
April 12, 2021
What an online tool reveals about COVID lockdowns and procrastination
A quantitative overview of procrastination in a worldwide pandemic context.
The COVID-19 has impacted the lives of everyone, worldwide. Beyond mortality, the pandemic has had significant economic, social and ecological consequences.
An important area to study is the "remote" trend and the lockdowns that caused it. Overnight, employees and students worldwide found themselves working from home, replacing in-person meetings with video calls and re-discovering their kitchen tables as workplaces.
What did lockdowns and remote work cause regarding mental health? Many studies have covered stress, anxiety, and burnout. This article focuses on a specific behavior: procrastination — and it does so through an unexpected lens.
A tool for shameless procrastinators
Corrupt-a-File, as the name suggests, is a tool to corrupt files on purpose. Users upload a file, the service corrupts it, and they get back a file that looks valid on the outside but fails to open.
Why would one want to corrupt files? The classic use case is the student or employee who hasn't finished an assignment in time. They send the corrupted file to their supervisor, claim a technical issue, and buy themselves a few extra days to complete their work.
This scenario is morally dubious, and we do not endorse it — the tool itself comes with the disclaimer that it "forces you to lie and can make you look suspicious." That said, it is precisely what makes Corrupt-a-File an interesting procrastination indicator: people use it when they are behind on something and desperate for more time.
By studying the traffic of Corrupt-a-File, we can get an understanding of the impact of lockdowns on procrastination, new procrastination patterns, and differences between countries.
Pre-COVID trends
Before investigating 2020 and 2021, let's dive into previous years to understand how Corrupt-a-File was used in the pre-COVID era.
This article shows curves of the amount of visitors per day or week, from Google Analytics. The data spans from 2017 to early 2021.
Typical year
There are four phases in a regular year, visible in the chart below:
- January–May: High traffic. It starts high in January, grows, then gradually declines, with a notable dip around Easter.
- June–August: Low traffic, forming a bowl-shaped curve. This corresponds to summer holidays worldwide.
- September–early December: High traffic resumes as school and work calendars restart.
- Late December: Traffic drops again with the year-end holiday period.
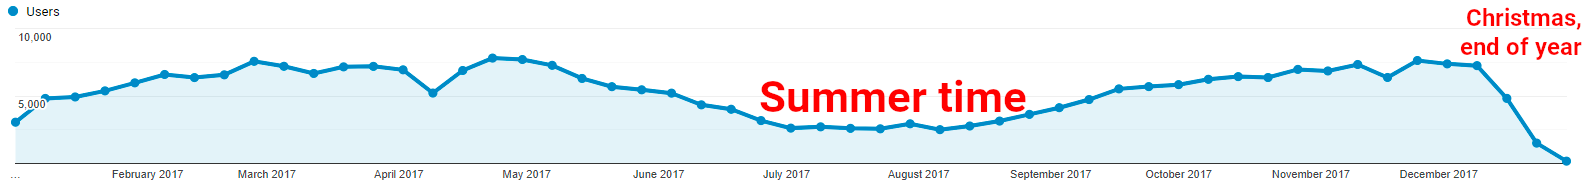
This curve reflects the activity worldwide. The dips and peaks map almost perfectly onto the global academic calendar — wherever students have deadlines, Corrupt-a-File sees traffic.
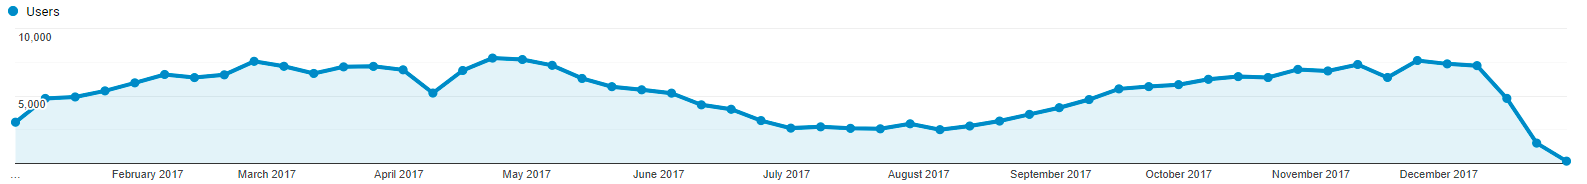
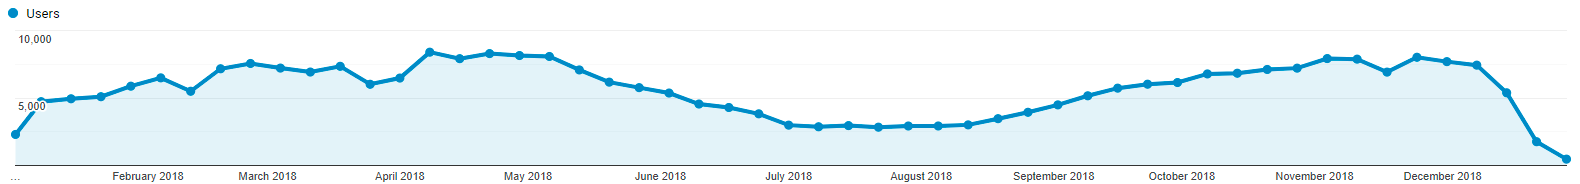
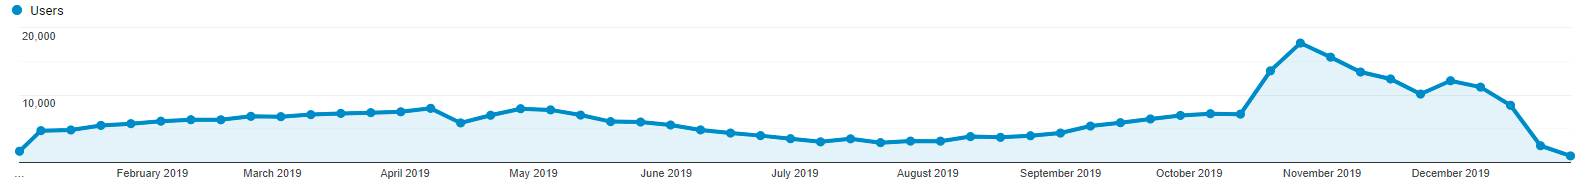
2017, 2018 and 2019 have demonstrated similar trends, with only a notable traffic increase in the fall of 2019 breaking from the established pattern.
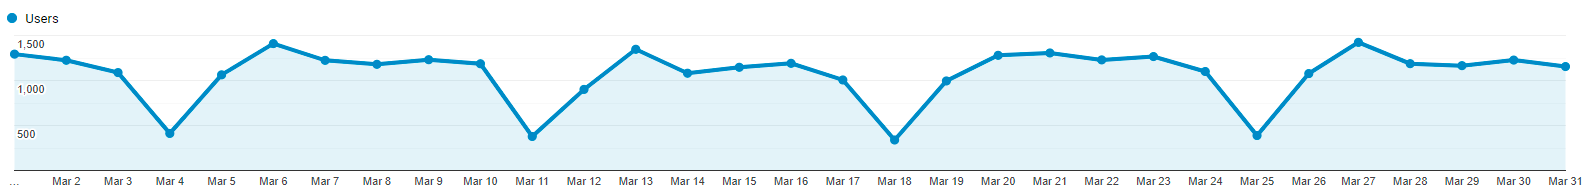
Typical week
The traffic varies during a typical week. Weekdays, especially from Monday to Thursday, are consistently busier than weekends. Saturday has minimal activity, while Sunday sees a notable bump as procrastinators face the upcoming workweek.
A note about Monday, which usually experiences a slight peak: this likely corresponds to assignments due at the start of the week, submitted at the last possible moment.
Here comes the lockdown
Lockdown is arguably the most emblematic measure used to fight COVID-19. Governments across the world imposed stay-at-home orders, shutting down schools, offices, and public spaces.
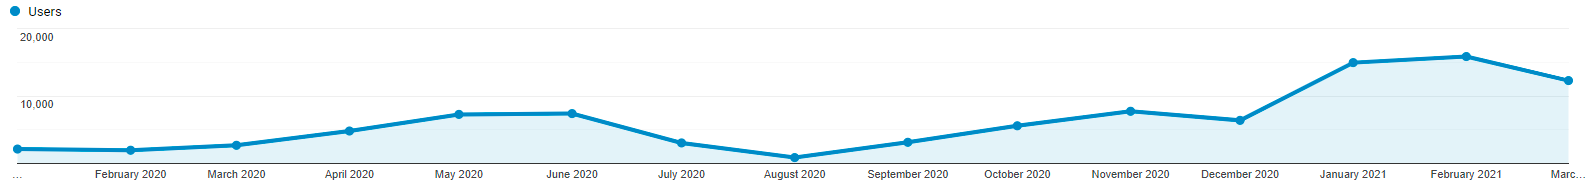
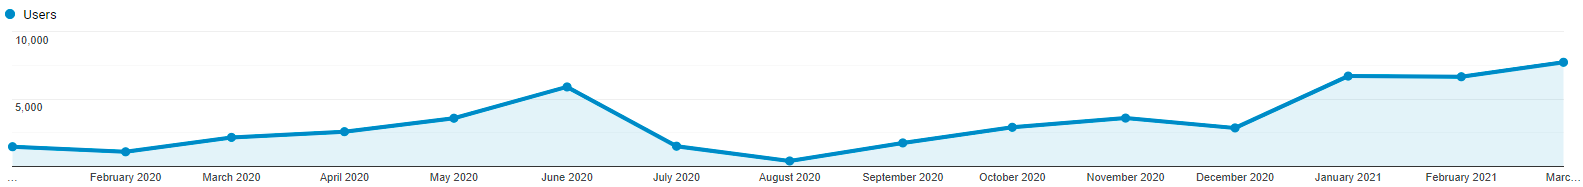
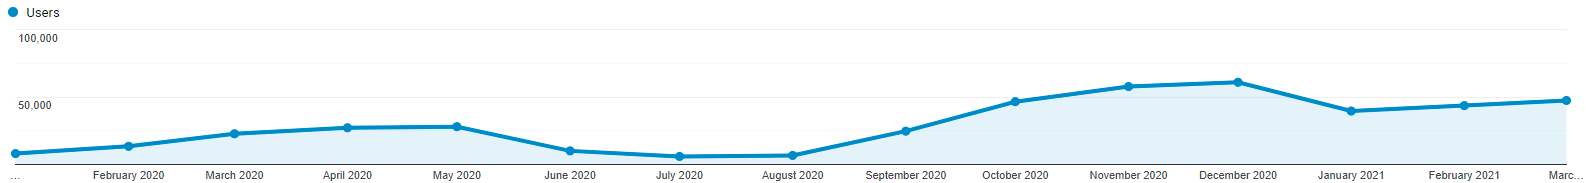
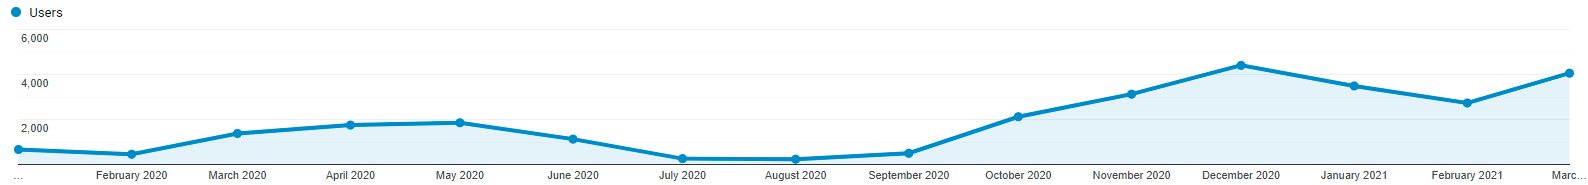
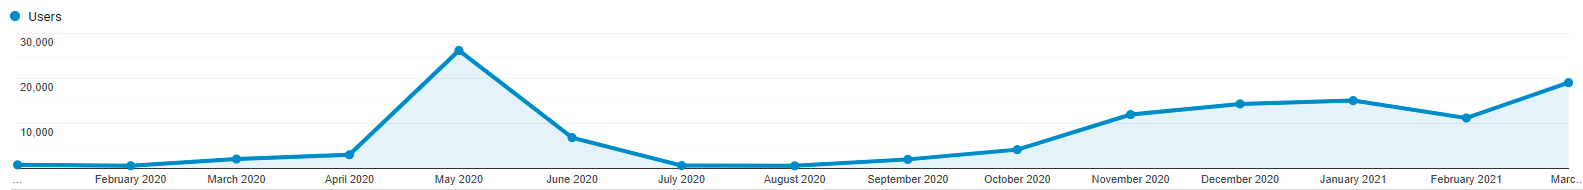
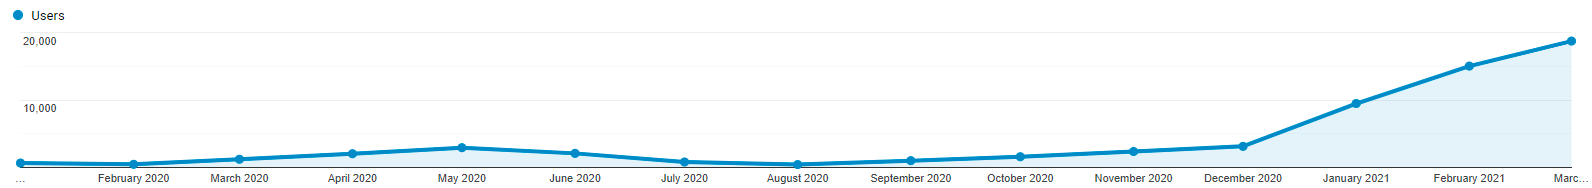
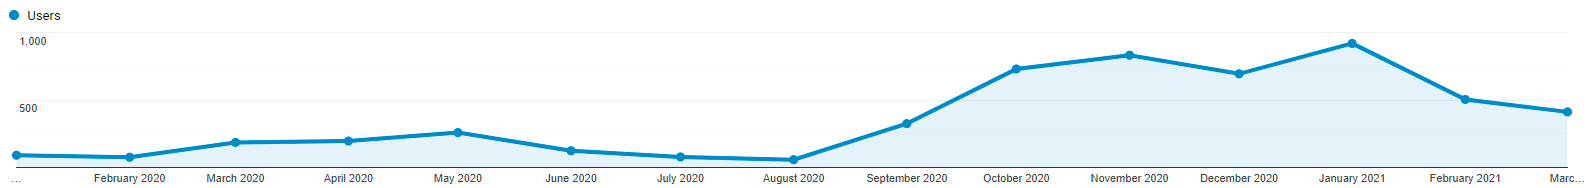
In many countries where a nationwide lockdown was established in March 2020, the traffic of Corrupt-a-File doubled almost overnight. The charts below show daily users in four countries around their respective lockdown dates:
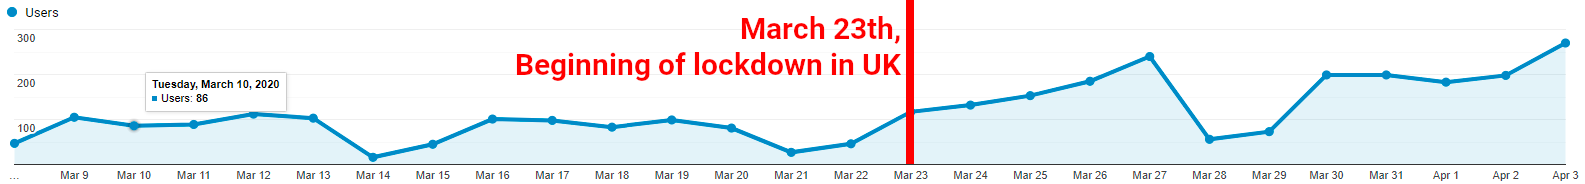
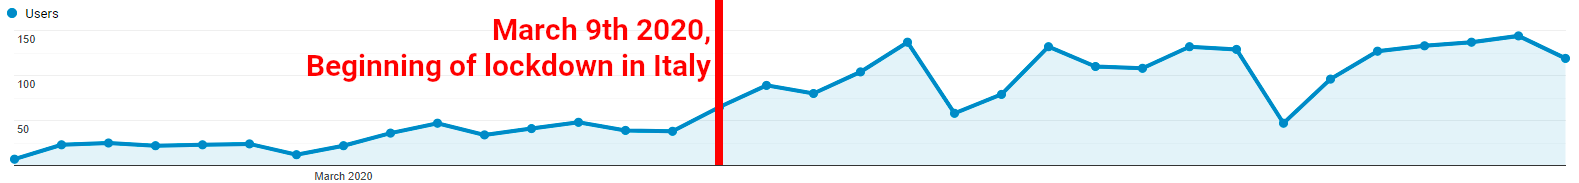
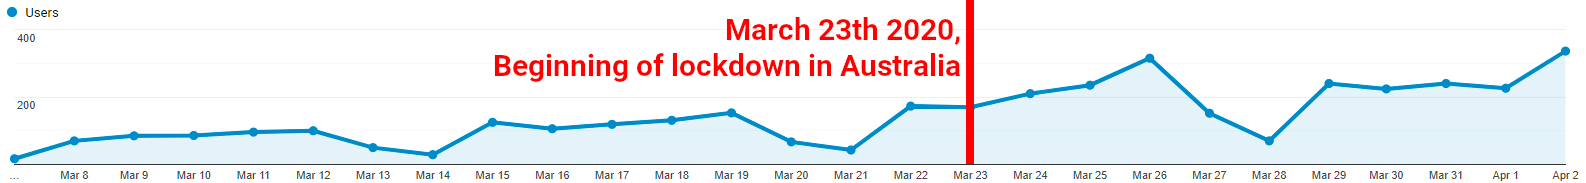
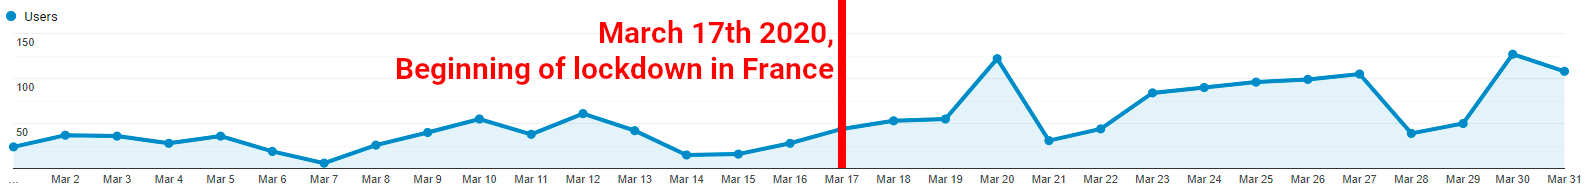
This phenomenon is clearly the consequence of lockdowns, and not the result of social media virality or some other concurrent event. The timing correlates exactly with the government announcements in each country independently.
In addition, most of Corrupt-a-File's traffic comes from search engines, not social media. Users find the tool when they actively need it — meaning the spike reflects genuine demand, not a trending moment.
A COVID-era pattern: Friday spikes
As said earlier, Monday used to be the most busy day. Working weeks followed a predictable rhythm: pressure built through the week, and the most desperate procrastinators acted on Monday when they ran out of time.
Now, the shape of a regular week is very different, with Friday being the other star on the stage. In the COVID era, Friday traffic spikes have become a recurring pattern — something that was almost never seen before.
This pattern was seldom observed pre-COVID. In the 55 weeks before March 15, 2020, Friday was the peak day only 3 times. In the 55 weeks after March 15, 2020, it occurred 21 times.
The explanation of this change in behavior is not straightforward. One hypothesis: working from home creates more emotional and psychological distance from supervisors. Ending the workweek by simply closing a laptop — rather than walking past colleagues — may make procrastinators bolder about pushing things to Friday.
The explosion of procrastination
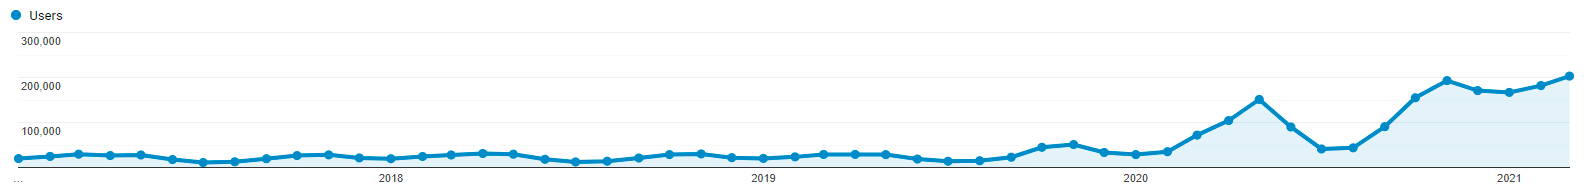
The graphic from January 2017 to March 2021 says it all. The before/after contrast is striking.
Corrupt-a-File has been relatively stable for the past few years, growing modestly each year in line with broader internet growth. Then 2020 happened.
In 2019, there were 300K visitors. In 2020, there were over 1 million — more than three times as many.
In January and February 2020 (the two COVID-free months of 2020), there were 60K visitors. In January and February 2021, there were 320K — more than five times as many.
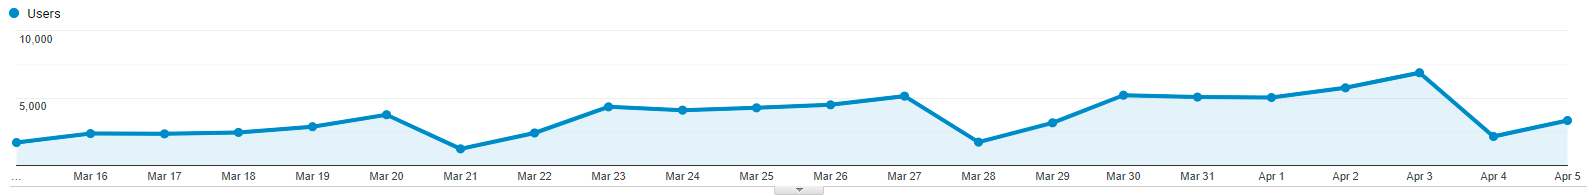
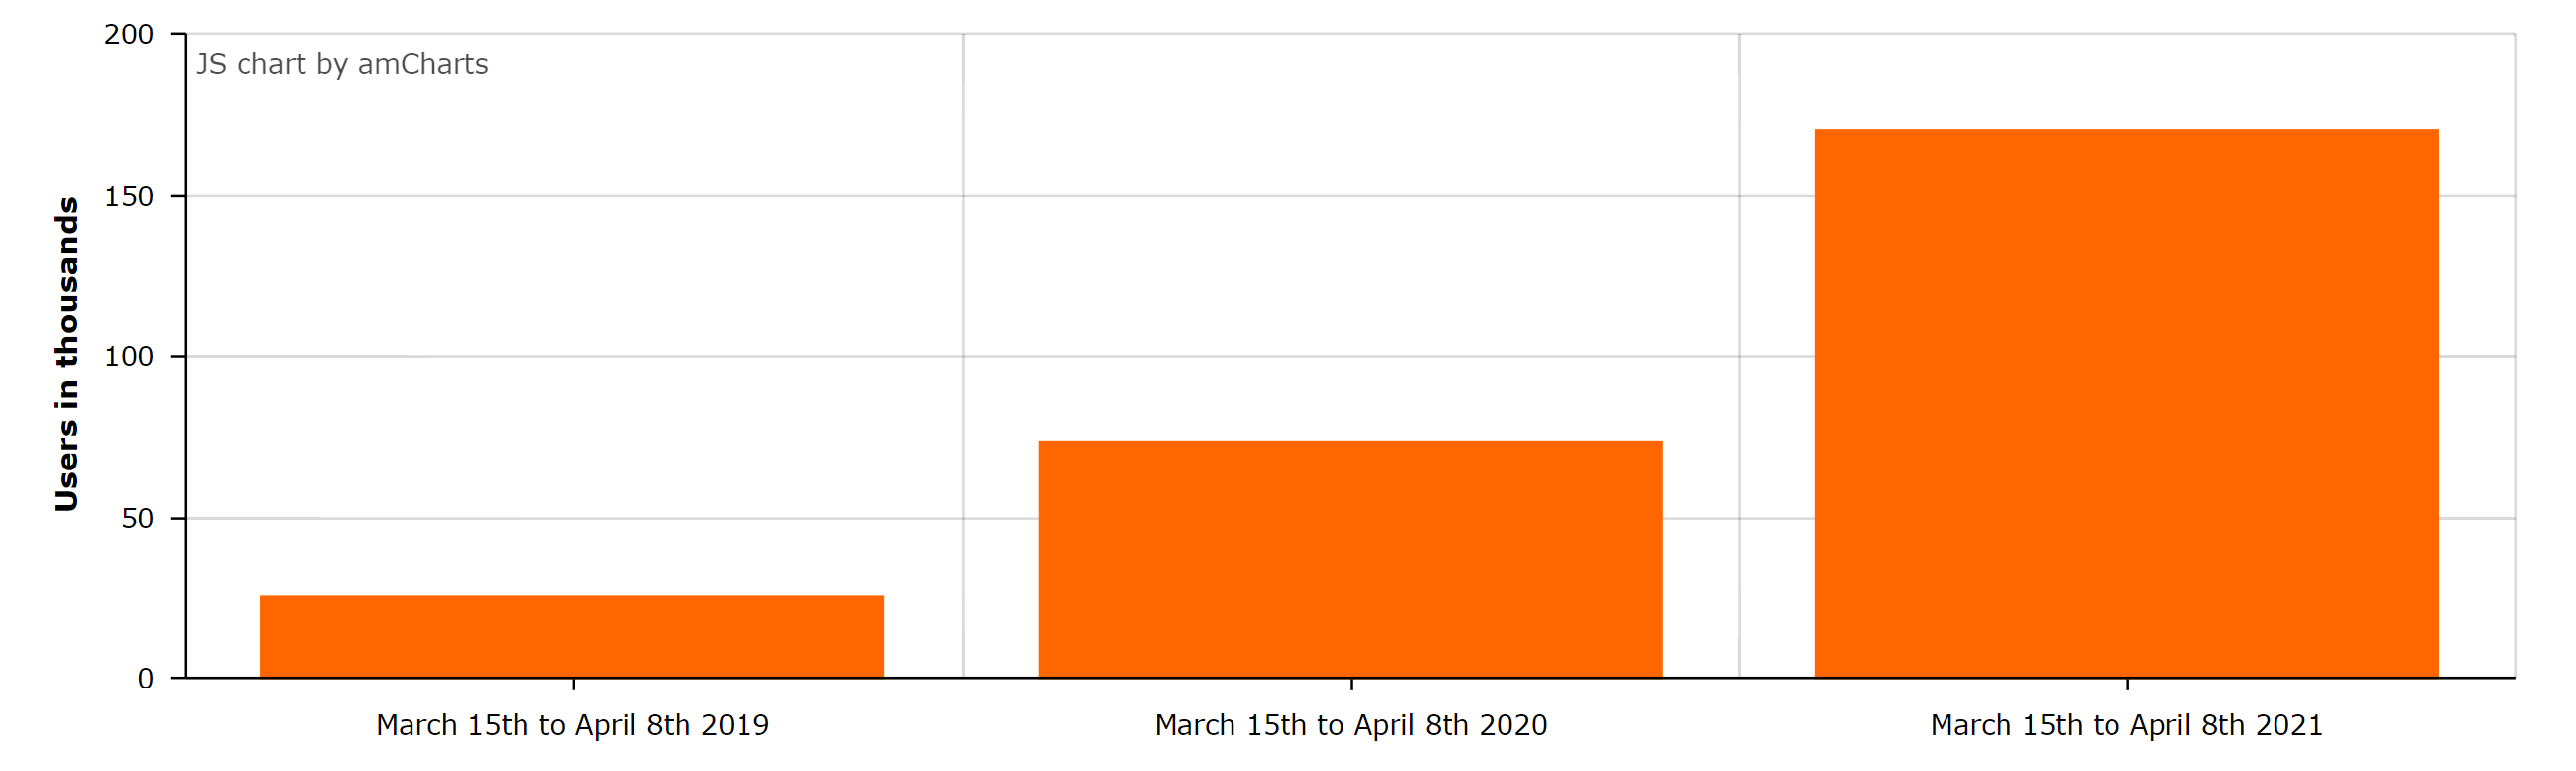
We might think of the situation as a binary pre- and post-COVID setting, but the data shows it is actually still accelerating. Comparing March 15th to April 8th across three years shows that 2021 traffic more than doubled 2020 figures, which had already sharply increased from 2019.
Discrepancies between countries
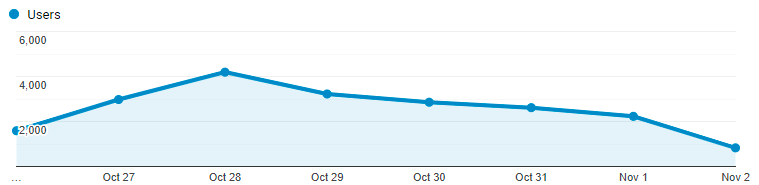
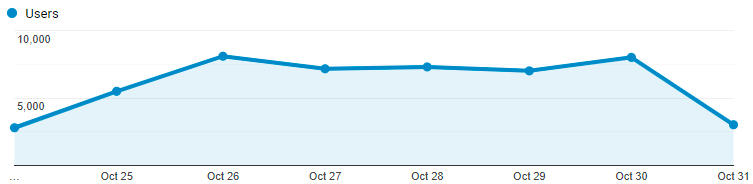
Many countries exhibit the same pattern: the first lockdown wave in March 2020 increased traffic, and the second wave in the fall of 2020 triggered an even larger increase.
Patterns
For the third wave, the pattern diverges. Some countries, like the UK and the Netherlands, saw traffic continue to rise through the third wave — higher than the second.
In some other countries, like the United States and France, the third wave hits less than the second one. This may reflect pandemic fatigue, shifting work habits, or changes in how remote work was managed over time.
Germany: a worrying, exponential evolution
Germany's case is unique. While most countries show a leveling off or a decline after the second wave, Germany shows an almost exponential growth trajectory — a roughly 6x increase from March 2020 to March 2021 with no signs of plateauing.
Israel: a sign of hope for vaccination campaigns
Israel is certainly an interesting case, since this country is the most advanced regarding the vaccination of its population. Israel began its rollout earlier and faster than any other country in the study.
Whereas the country follows the same high-first-wave-then-very-high-second-wave pattern, there is a clear drop during the third wave. In 2019, Israel showed a consistent January-to-March traffic level. The 2021 third wave is notably lower than the second — the opposite of most other countries studied.
If this pattern holds, it may represent the earliest data point we have linking vaccination progress to a return toward pre-pandemic behavioral norms.
Conclusion
With so many comments about the impact of COVID and lockdowns on mental health, the review of Corrupt-a-File's analytics offers original insights. By looking at a tool that is used specifically in moments of procrastination and deadline pressure, we get a window into how the pandemic has reshaped work behavior worldwide.
The analysis reveals an explosion of procrastination around the world, with an overall increase while the crisis continues. Remote work appears to have fundamentally changed the relationship many people have with deadlines, supervision, and the rhythm of the workweek.
While many countries share the same trend, some experience a worsening (Germany), while others might see the early benefits of the vaccination campaigns (Israel). As 2021 unfolds, it will be worth watching whether the vaccination rollout brings behavioral patterns — including procrastination — back toward their pre-pandemic baselines.